On 26 October, Anthropic published the prospectus for its planned listing on Nasdaq, under the ticker ANT. The filing puts first-half revenue at $16.3 billion, around fourteen times the $1.16 billion it reported for the same period last year.
Those figures cover Anthropic’s business worldwide, much of it from large enterprise contracts and API usage. Card data shows something closer to the ground: what companies pay for, month after month, to keep their tools running.
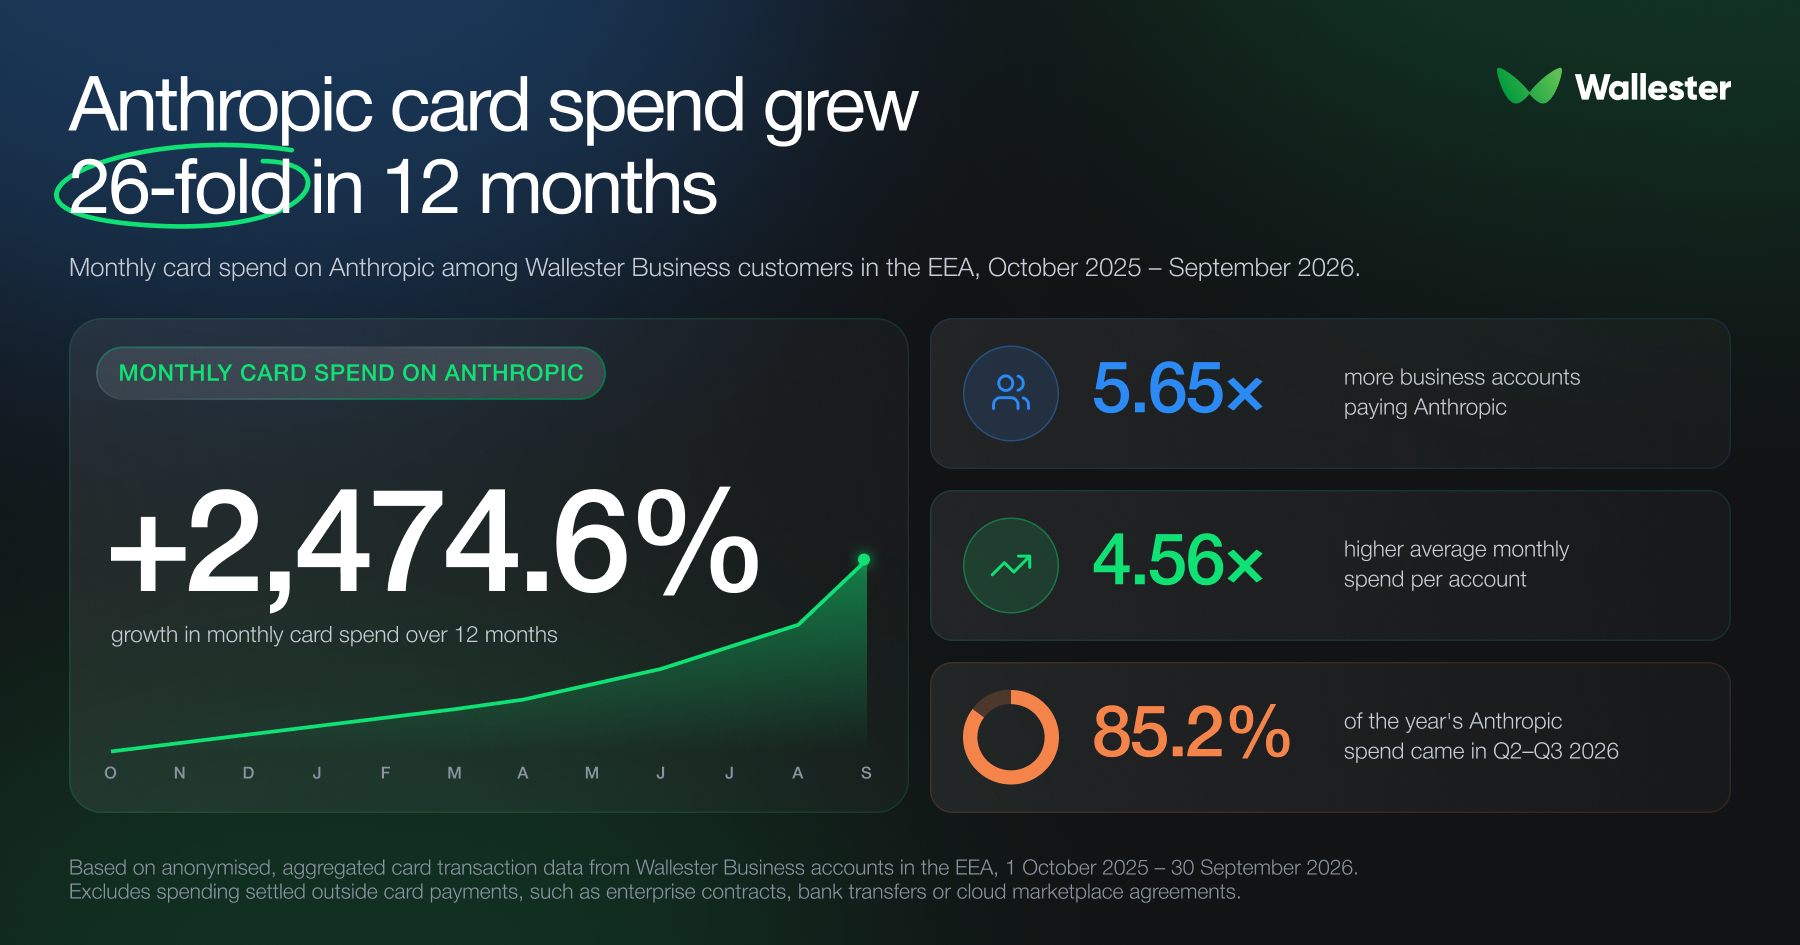
We analysed card payments to Anthropic across Wallester Business accounts in the European Economic Area over the twelve months from October 2025 to September 2026. Over that period, monthly card spend on Anthropic grew by 2,474.6%, to almost 26 times its starting level. And since January alone, it has grown more than eightfold.
Most of the year’s spend arrived in the last six months
Most of that growth arrived late in the period. More than half of all twelve-month card spend on Anthropic, 51.4%, came in the third quarter of 2026 alone. The second and third quarters together account for 85.2%.
Quarterly growth rates eased as the base grew larger, but each quarter still finished well ahead of the last. Spend almost quadrupled in the first quarter of 2026 and almost tripled in the second. The third quarter added another 52.1%.
New customers and bigger bills
Growth this fast can come from two places: more companies paying, or each company paying more. For Anthropic, it came from both.
The number of business accounts paying Anthropic grew 5.65 times over the twelve months. Average monthly spend per account grew 4.56 times. Together, those two effects explain the full 25.7-fold increase.
The rise in spend per account points to companies moving beyond individual subscriptions, towards team plans and usage-based billing as Claude becomes part of daily work.
March was the turning point
The sharpest single month was March 2026, when card spend on Anthropic rose by 134.7%. Both sources of growth moved together. The number of paying accounts rose by 56.9% in a month, and spend per account rose by 49.5%.
Monthly spend has stayed well above March’s level ever since.
Growth that doesn’t move in a straight line
The climb wasn’t entirely smooth, but that may simply have to do with the holiday season. In August, when many teams slow down, monthly spend on Anthropic fell by 21.1% from July’s peak, then recovered by 24.4% in September.
For finance teams, that is the practical side of AI adoption. Many AI tools combine a base subscription with usage-based charges or prepaid credits, so a busy month for the engineering team can mean a much bigger bill, and a quiet one a smaller one. Few other software costs swing like that from month to month.
Taming the AI subscription stack
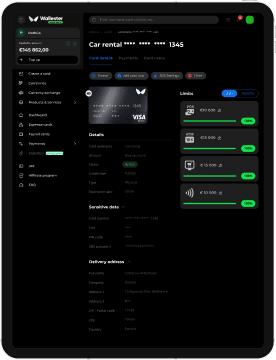
AI subscriptions have become a standard line item in company spending. Wallester Business keeps that spending visible and within budget as it grows.
When a company opens an account, it can:
- issue a separate virtual card for every AI vendor, keeping each tool’s billing apart from the rest of the company’s spend.
- set real-time limits on each card, so usage charges and automatic top-ups stop at the agreed budget.
- use card controls to restrict where each card can be used.
- hold money in multi-currency accounts, with in-platform exchange for tools priced in US dollars.
- see every transaction as it happens, with receipts attached and Xero or QuickBooks kept in sync.
Engineering teams will keep adding tools as the models improve. When each one has its own card and its own limit, finance can approve new software without guessing at next month’s bill. Wallester Business brings those cards together with a business account and expense management on one platform, so the company’s day-to-day finances and its spending controls sit in one place.
Opening an account is free, and companies can easily move to a paid plan when they need more.

Methodology
This analysis is based on anonymised, aggregated card transaction data from Wallester Business accounts in the European Economic Area, covering payments to Anthropic between 1 October 2025 and 30 September 2026. All figures are shown as growth rates, shares or index values to protect client data. Merchants are classified using merchant category codes and merchant descriptors. Spending settled outside card payments, such as enterprise contracts, bank transfers or cloud marketplace agreements, is not included. The data reflects Wallester Business customers and may not represent all businesses in the EEA.