Anthropic and OpenAI dominate the coverage of artificial intelligence, and in our own card data they take most of the business budget too. But set them aside, along with xAI, and a different market of comes into view: smaller, specialised AI tools that businesses pay for alongside the big model providers, each built for a particular job.
We analysed anonymised card payments to those specialised vendors across Wallester Business accounts in the European Economic Area between January and October 2026. Over the ten months, they accounted for a little under 30% of all AI card spend.
Their share changed considerably over the year. It moved from about 49% in January to about 16% in October, mainly because spending on the largest model providers grew faster. However, spending on the specialised tools still rose in absolute terms over the same period.
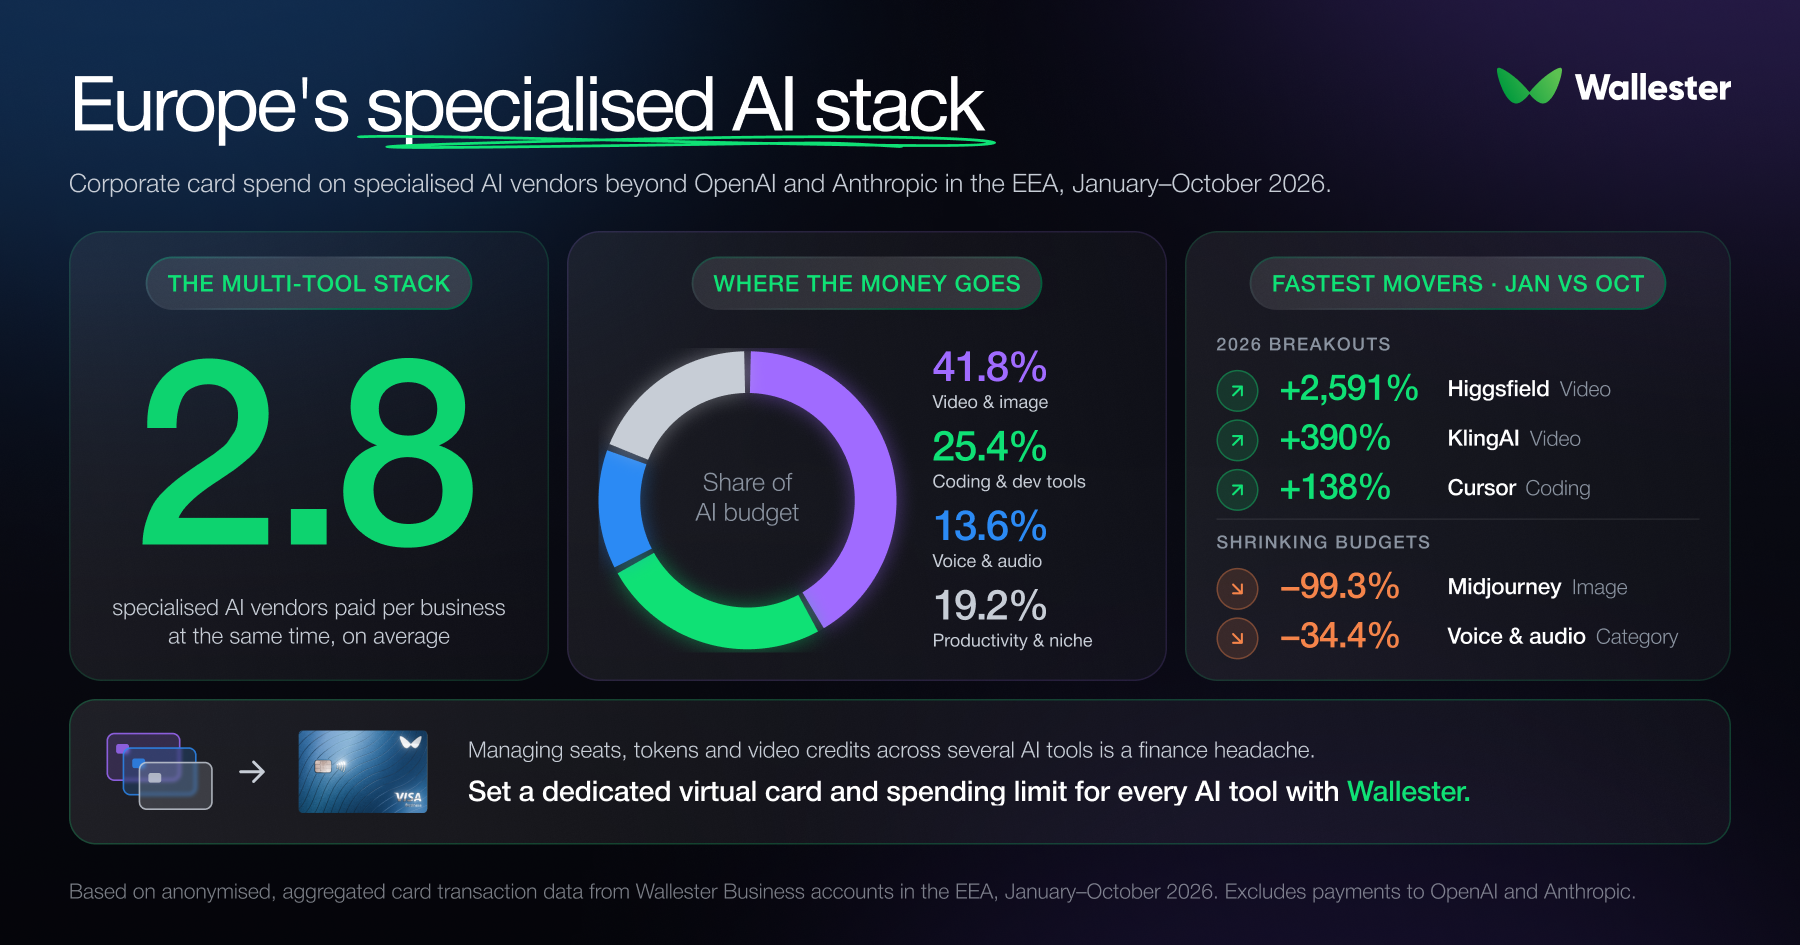
Also, among businesses paying for specialised AI tools, the average account now pays for 2.8 different vendors at the same time.
Where the specialised budget goes
Video and image generation is the largest category, with 41.8% of specialised AI spend over the ten months. Coding and developer tools follow at 25.4%, then voice and audio generation at 13.6%. Text and search chatbots account for 4.9%, productivity tools and AI agents account for 2.6%, and a mix of niche tools makes up the remaining 11.7%.
How fast each category is growing tells a different story from how big it is.
Coding grows fastest
Monthly spend on coding and developer tools rose by 129.3% between January and October, faster than any other category. Most of that growth came from Cursor, an AI code editor, which grew by 138.6%.
Tools like Cursor can combine a subscription with usage-based charges, so heavier use by developers shows up directly in the bill. As AI moves into the editor developers work in every day, that spending becomes part of the regular engineering budget.
Video moves ahead of still images
Spend on video and image generation grew by 79.1%, while the mix inside the category changed. Higgsfield, a video generator, grew by 2,591% from a small base in January. KlingAI rose by 390.5%, and HeyGen, which creates AI avatars and localised video, by 104.8%.
Midjourney went the other way. Card spend on the image generator fell by 99.3%. In our data, at least, video tools are taking a growing share of the creative budget that once went to still images.
Voice settles around one leader
Voice and audio was the only major category to shrink, with monthly spend down 34.4%. ElevenLabs bucked that trend, growing by 45.6%. That suggests some businesses have cut back the voice tools they were testing and settled on one.
Productivity tools and AI agents grew more slowly, by 10.3%, in line with steady adoption of AI-native workspace and project tools.
A stack that bills in different ways
For finance teams, these tools are harder to manage because each one bills differently. Productivity tools often charge fixed monthly seats. Video platforms may run on credit packs that top up automatically, and coding tools can add usage charges that rise during a busy sprint.
Put 2.8 of these side by side, across different departments, and the monthly AI bill becomes harder to predict. A heavy week of video rendering or development work can trigger a top-up that nobody approved in advance.
One card for every tool
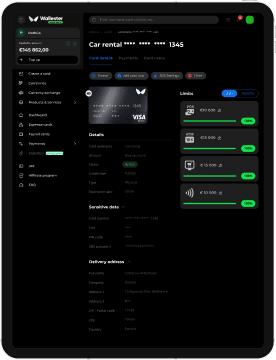
Wallester Businessgives each AI vendor its own place in the budget. When a company opens an account, it can:
- Issue a dedicated virtual card for every tool, so each vendor’s charges are easy to track.
- Set a limit on each card, so automatic top-ups and usage charges stop where the budget does.
- Restrict each card to the merchant it’s meant for.
- Pay tools billed in US dollars from a multi-currency account, with exchange inside the platform.
- See every charge as it happens, with receipts attached and Xero or QuickBooks kept in sync.
All of this sits alongside a business account with its own IBAN, on one platform. Opening an account is free, and the tool whose bill moved most last month is a good place to start.
Methodology
This analysis is based on anonymised, aggregated card transaction data from Wallester Business accounts in the European Economic Area, covering 1 January to 1 November 2026. It excludes payments to OpenAI, Anthropic and xAI. All figures are shown as shares or growth rates to protect client data. Growth compares October monthly spend with January. Merchants are classified using merchant category codes and merchant descriptors. Spending settled outside card payments, such as invoices or cloud marketplace agreements, is not included. The data reflects Wallester Business customers and may not represent all businesses in the EEA.