


To see where exactly digital ad money goes, it helps to know how the buying works. When a company hires an agency to run its ads, the money usually reaches the platforms through a corporate card, topped up so campaigns never pause. That card activity is a useful read on where agencies put their ad money.
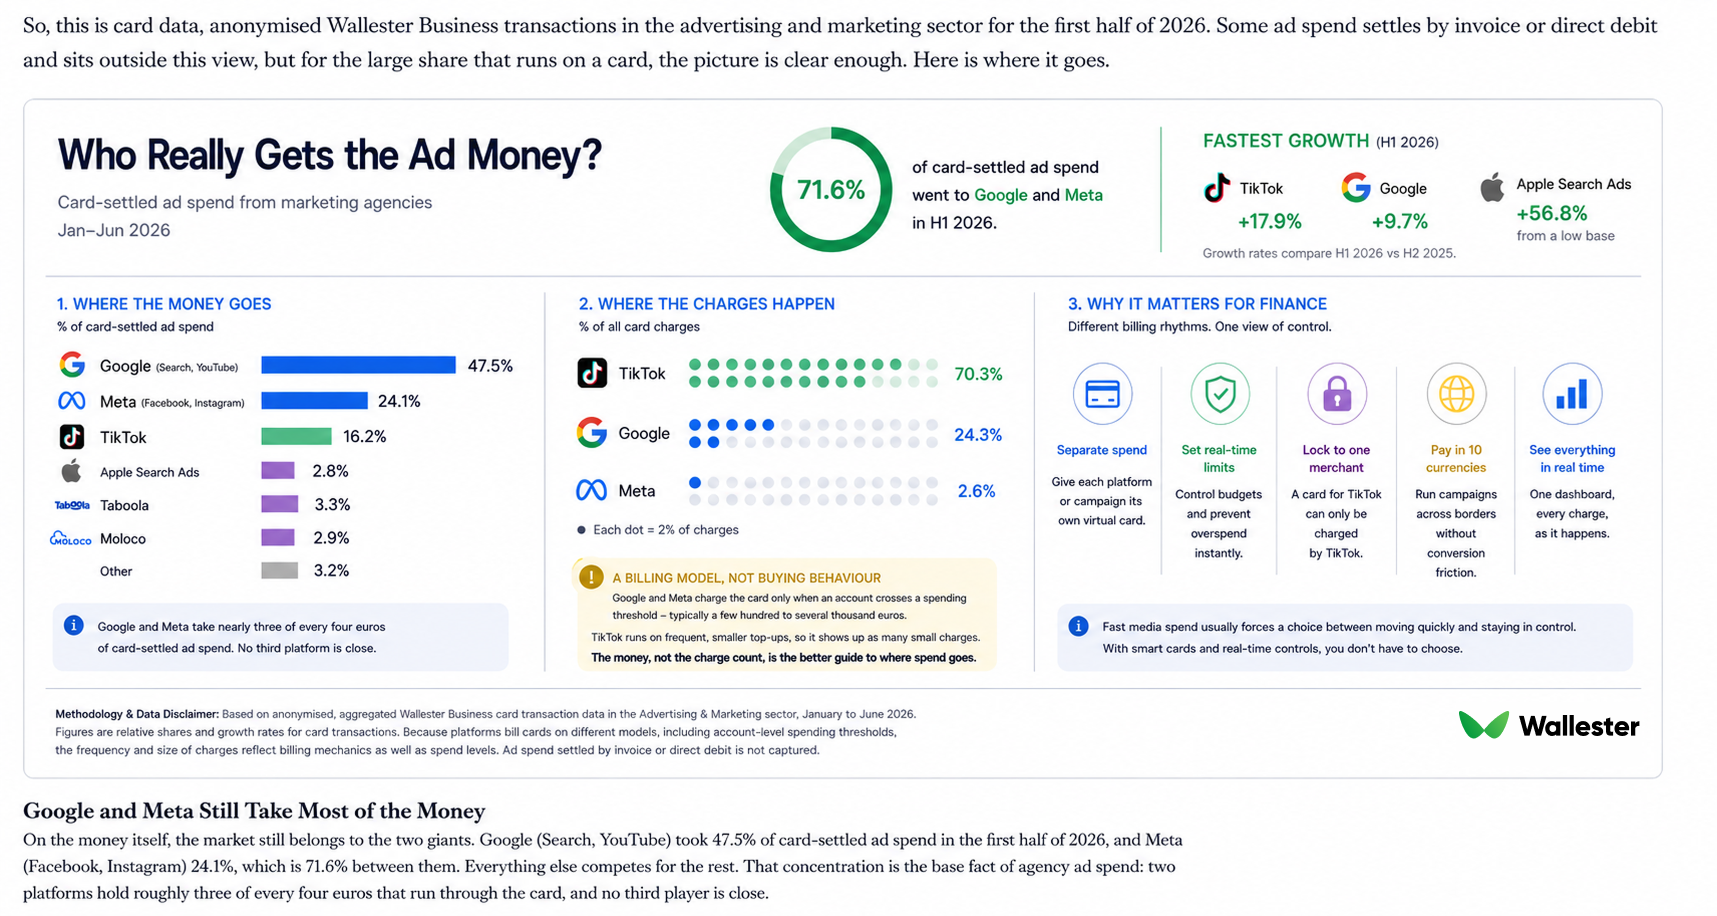
So, this is card data, anonymised Wallester Business transactions in the advertising and marketing sector for the first half of 2026. Some ad spend settles by invoice or direct debit and sits outside this view, but for the large share that runs on a card, the picture is clear enough. Here is where it goes.
Google and Meta Still Take Most of the Money
On the money itself, the market still belongs to the two giants. Google (Search, YouTube) took 47.5% of card-settled ad spend in the first half of 2026, and Meta (Facebook, Instagram) 24.1%, which is 71.6% between them. Everything else competes for the rest. That concentration is the base fact of agency ad spend: two platforms hold roughly three of every four euros that run through the card, and no third player is close.
It is worth sitting with how durable that is. For all the talk of fragmenting audiences and new channels, the money has stayed with the two platforms that can reliably find customers at scale. An agency can test a dozen networks in a quarter and still send the overwhelming majority of its budget to the same two names it used last year.
Where the Momentum Is
Size and direction are different questions, and on direction TikTok stands out. It holds 16.2% of card spend, less than half of Meta’s share, but it grew 17.9% over the half, against Google’s 9.7%. The money still sits with the incumbents, but the fastest-moving of the majors is the newer one, which is the number to watch if the trend holds.
Among the smaller channels, Apple Search Ads grew fastest of all, up 56.8% to reach 2.8% of card spend as agencies bid harder for App Store placement, though that comes off a small base. The rest of the long tail is modest: Taboola, which places sponsored content on news sites, at 3.3%, and Moloco, a programmatic mobile network, at 2.9%. None of these is close to challenging the top two, but together they show agencies spreading a slice of budget across specialist placements the giants don’t cover.
A Word on How Often the Card Gets Charged
One number in the data is easy to misread, so it is worth being clear about. Alongside how much each platform takes, the card shows how often it charges, and the two look nothing alike. Google is 24.3% of all charges despite taking nearly half the money. Meta is just 2.6%. TikTok is a striking 70.3%.
That gap is mostly the billing model, not buying behaviour. Google and Meta charge the card only when an account passes a spending threshold, and those thresholds are large and set per account, running from a few hundred euros to several thousand. With Meta, the threshold also climbs as the account builds history, so an established account is billed rarely and in large amounts. TikTok leans on frequent, smaller top-ups, so it shows up as a steady stream of little charges. It is tempting to read TikTok’s charge count as agencies favouring it, but the frequency better reflects how it takes payment.
Why It Matters for Finance
Put the two together, the money concentrated in a few platforms and the charges arriving in completely different rhythms, and you have one of the messier reconciliation jobs in a finance team’s month. One platform lands as a rare four-figure charge, another as dozens of small ones, each in its own currency and spread across client accounts. It gets harder the more platforms and markets are in play. Wallester Business is built to keep that legible from the first charge.
An agency running on Wallester Business can:
- Give each ad platform or client campaign its own virtual card, so spend is separated from the start
- Set real-time limits on every card, so a threshold charge or a runaway campaign can’t exceed its budget
- Lock a card to one merchant, so a card funding TikTok can only be charged by TikTok
- Hold and pay in 10 currencies, so cross-border platforms don’t add a conversion cost
- See every card and charge in one dashboard the moment it lands, rather than at month-end
Fast media spend usually forces a choice between moving quickly and staying in control. Giving each platform and client its own card and limit is what removes that choice, and turns a stack of differently shaped charges into something a finance team can read at a glance.
Methodology & Data Disclaimer: Based on anonymised, aggregated Wallester Business card transaction data in the Advertising & Marketing sector, January to June 2026. Figures are relative shares and growth rates for card transactions. Because platforms bill cards on different models, including account-level spending thresholds, the frequency and size of charges reflect billing mechanics as well as spend levels. Ad spend settled by invoice or direct debit is not captured.

