
Every year, companies publish strategy documents and presentation decks about operational efficiency, cost discipline, doing more with less, and so on. Then they actually spend the money, and the two things do not always match.
We analysed corporate card transaction data across the EEA and UK for 2025, meaning every category and every merchant code across Wallester Business clients. There was no doubt about the number one spot: “Advertising Services” captured 7.04% of total corporate spend. “Computer Software Stores” came second at 1.99%. In other words, the gap between first and second place was three and a half times.
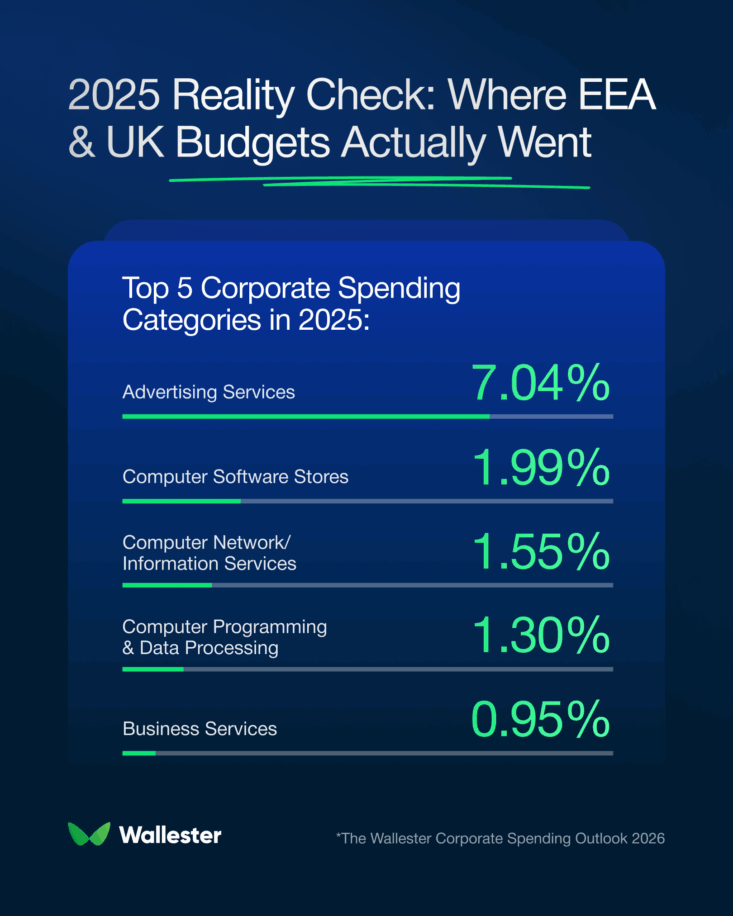
What the Top Five Tells You
“Computer Network and Information Services”, “Computer Programming and Data Processing”, and “Business Services” took the remaining spots, rounding out a list that is almost entirely technological.
This is partly a function of how corporate cards get used. They tend to capture digital and operational spend rather than payroll or large vendor transfers. But the concentration is still telling. Four of the top five categories are linked to the products and services businesses buy either to grow or to stay operational, and the category that dominates by a wide margin is the one pointed directly at customer acquisition.
Also, it is worth noting what is absent. Travel, office costs, or hospitality, for example, did not feature prominently, even though these were categories expected to normalise post-pandemic. So, the corporate card budget in 2025, at least across the EEA and UK, was a working budget. Put simply, money moved towards output rather than overhead.
The Efficiency Narrative Has a Spending Problem
Over the past two years, there has been a lot of talk about headcount freezes, software audits, and negotiating vendor contracts. Finance leaders kept beating the drum on doing more with less, while boards pushed for margin improvements. By several measures, those talking points produced some results.
Yet the transaction data suggests they had limits. Because when you look at what actually moved on corporate cards over the past year, advertising not only survived the efficiency drive but firmly held its ground. It dominated the entire spending picture by a wide margin.
That is a deliberate choice, made repeatedly, and surely not an accident. The formula seems clear: protect the spend directly tied to revenue and negotiate whatever else can be negotiated. Customer acquisition, obviously, was not negotiable. Software licences, service contracts, and infrastructure costs faced scrutiny. Ad budgets are less so.
What explains it? Often, advertising spend is tied directly to revenue targets, and if the growth number does not change, then the acquisition budget needed to hit it most likely does not change either. Efficiency programmes tend to be most effective against discretionary and overhead spend, and those were not the categories that made the top five.
What This Means for Finance Teams
The concentration of spend in a single category creates its own challenges. When advertising dominates the card budget – and campaigns can scale quickly across multiple platforms, managed by multiple people, often in different markets – the margin for untracked or misallocated spend widens fast.
A finance team running retrospective reconciliation on that kind of spend is always behind. By the time the month closes and the transactions are matched, a campaign has already run over, a card has been used for the wrong platform, or a budget meant for one market has bled into another. Think of it as a problem of timing and visibility rather than the spending itself.
But a card setup with pre-set limits by campaign, platform, or team changes the picture. Not by reducing spend, but by making it visible and organised before the month closes. Finance knows what has been committed the moment it is committed, not when someone gets around to filing a report.
That is exactly the kind of spend pattern a card issuing and spend management solution like Wallester Business is built for. The 2025 data is a reasonable illustration of why it will matter even more going forward.
And if you want to put this into practice, here’s what you get at no cost and no monthly fees:
- 300 free virtual Visa cards – One per platform, campaign, or team. Every card named, budgeted, and tracked independently.
- Pre-set spending limits – Set hard limits by card, employee, or category before the spend happens, not after.
- Unified real-time dashboard – Every transaction visible the moment it is authorised. The month-end reconciliation problem disappears when you can see spend as it moves.
- Tokenised cards for the mobile workforce – Full compatibility with Apple Pay, Google Pay, Garmin Pay, and more.
- Payroll and team payments – Up to 1,500 transactions executed in a single click.
- Native integrations – Direct sync with Xero and QuickBooks, or build custom flows via REST API.
We surveyed SME founders and finance leaders across Europe, then cross-referenced their answers against 4.6 million real transactions. The full picture is in the Wallester Corporate Spending Outlook 2026.